
Understanding some Machine Vision AI Core Metrics
Over the past decades, Machine Vision has become indispensable in Automotive Manufacturing, providing solutions that are robust, reliable, and suited to meet the high demands of quality and cost efficiency. Recently, though, the introduction of deep learning technologies is revolutionizing this field. The precision and efficiency of these technologies have significantly helped for instance to ensure that all vehicles leaving the production line meet the highest quality standards. However, the effectiveness of these systems is contingent upon a suite of evaluation metrics that objectively measure their performance. This article delves into some of these critical metrics, such as recall, precision, true positives (TP), false positives (FP), true negatives (TN), false negatives (FN), and the F1 score, providing insights into their importance and application in enhancing automotive manufacturing through machine vision.
True Positives (TP) and True Negatives (TN)
True Positives (TP): These are cases where the machine vision system correctly identifies a defect in a car part. For instance, if a system is designed to detect scratches on a car door and does so accurately, it is considered a TP.
True Negatives (TN): This metric refers to instances where the system correctly identifies that a part does not have the defect it’s programmed to find. Using the same example, a car door without scratches and recognized as such by the system is a TN.
Both TP and TN are indicators of a system’s accuracy in identifying defects and their absence, respectively.
False Positives (FP) and False Negatives (FN)
False Positives (FP): These occur when the system mistakenly identifies a defect in a part that is actually defect-free. This can lead to unnecessary rework or scrutiny, impacting the production efficiency.
False Negatives (FN): Conversely, FNs happen when the system fails to detect a real defect. This can have more dire consequences, like allowing defective products to reach customers.
Minimizing FP and FN rates is crucial for maintaining high quality and efficiency in production lines.
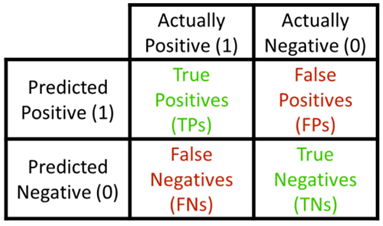
Confusion Matrix
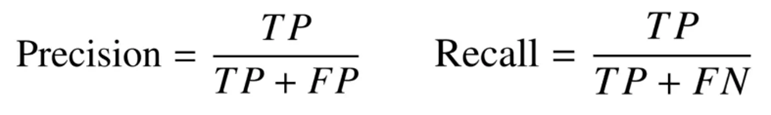
Precision and Recall
Precision: This metric measures the accuracy of the defect detections made by the system. It is the ratio of TP to the sum of TP and FP. High precision indicates that most of the defects identified by the system are indeed defects, minimizing wasteful checks on false alarms.
Recall (Sensitivity): Recall assesses the system’s ability to detect all actual defects. It is calculated as the ratio of TP to the sum of TP and FN. High recall means the system misses very few defects, crucial for ensuring product quality.
Both precision and recall are critical: We all want a system that doesn’t cry wolf too often (high precision) but also doesn’t let defects slip through (high recall).
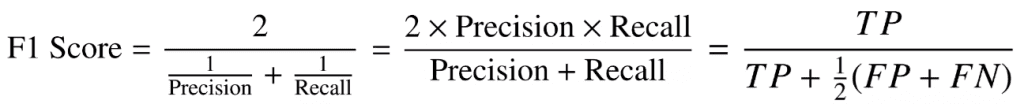
F1 Score
The F1 score harmonizes precision and recall into a single metric, providing a balanced view of a system’s overall performance. It is the harmonic mean of precision and recall, giving a comprehensive measure that considers both the false positives and false negatives. The reason why we use the harmonic mean instead of a simple arithmetic or geometric mean is very interesting, so I encourage interested readers to explore this topic further at https://encr.pw/g3xXJ
A high F1 score indicates a robust system that accurately identifies defects while minimizing false detections. This metric is useful when we want to compare different modеls or tunе hypеrparamеtеrs.
The Delicate Balance: Precision vs. Recall
The balance between precision and recall often hinges on the cost of false positives versus false negatives. In the context of automotive manufacturing, for critical components where defects could lead to safety issues, a higher recall might be prioritized, but for cosmetic features, higher precision could be more desirable to avoid unnecessary rework.
Real-world Application and Challenges
Implementing machine vision systems in automotive manufacturing presents challenges, such as varying lighting conditions, complex part geometries, and the wide variety of defects. The mentioned metrics and others, guide the tuning of deep learning models to meet specific quality control requirements. For instance, adjusting the model to increase recall might involve lowering the threshold for defect detection, potentially increasing false positives but ensuring no defect is missed.
Conclusion
The advent of AI in machine vision in automotive manufacturing heralds a new era of quality control, characterized by unprecedented accuracy and efficiency in solving problems that were difficult or impossible to address with traditional machine vision tools. By deploying machine vision plus deep learning algorithms and continuously refining them through the metrics discussed in this article, the automotive industry can look forward to a future where defects are the exception, not the norm, ensuring the safety and satisfaction of customers around the world.