The Dashboard application is designed to meet these demands by consolidating all defect data into one intuitive platform. This tool helps manufacturers quickly identify problem areas, understand defect patterns, and drive continuous improvement.
What Is Dashboard and How Does It Work?
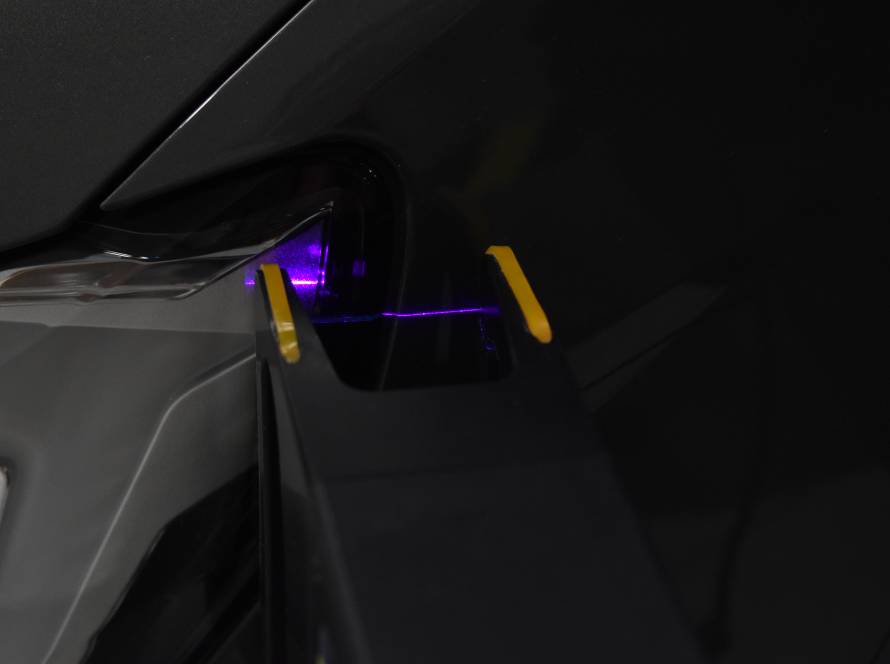
Dashboard is a comprehensive software solution that collects defect information from our vision inspection systems and centralizes it for easy access. It provides a visual overview of defect occurrences, showing detailed photos and exact locations to facilitate rapid root cause analysis.
By gathering real-time data, Dashboard allows quality control teams and production managers to monitor defects as they happen, making it easier to intervene before problems escalate.
Visualize Defects Like Never Before: Location Mapping and Photo Documentation
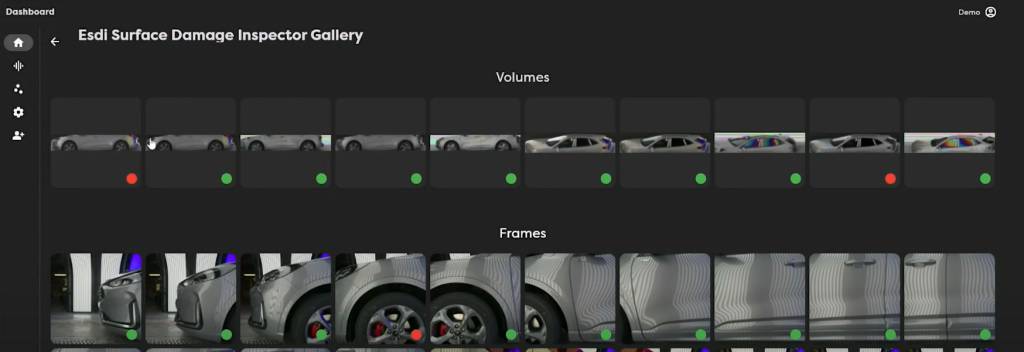
One of Dashboard’s key strengths is its ability to map defects precisely on product models or assembly lines. This geospatial visualization helps users instantly recognize where defects cluster, which parts are most affected, and whether issues are isolated or systemic.
Each defect entry includes high-resolution photos or images captured automatically. These visuals provide context, enabling engineers to better understand defect types and contributing factors without needing to physically inspect every fault.
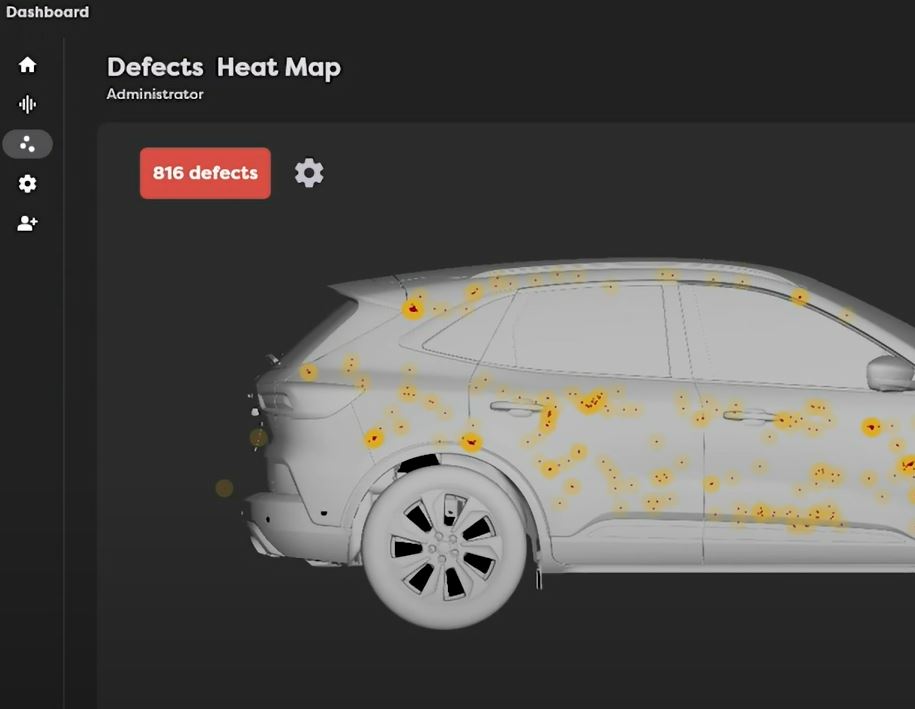
Uncover Patterns with Heat Maps and Advanced Analytics
Dashboard transforms raw defect data into actionable insights using heat maps that display defect density over time. These colorful, easy-to-read maps highlight hotspots where defects are most frequent, revealing hidden trends that might otherwise go unnoticed.
Additionally, Dashboard offers powerful filtering and analytics tools. Users can segment defect data by:
- Time periods (shifts, days, weeks)
- Production stations or lines
- Defect categories and severity
- Specific components or batches
This flexibility empowers teams to identify root causes, monitor improvement efforts, and optimize production processes.
Why Dashboard Is Essential for Modern Quality Control
- Faster defect detection and response reduces downtime and waste.
- Improved traceability helps meet regulatory and compliance requirements.
- Enhanced communication between quality, production, and maintenance teams streamlines problem-solving.
- Data-driven insights enable continuous process improvements and higher product quality.
Conclusion: Take Control of Your Quality with Dashboard
By centralizing defect data and offering powerful visualization and analytics tools, Dashboard empowers manufacturers to proactively manage quality challenges. This application is not just a tool—it’s a strategic asset that drives efficiency, reduces costs, and supports the production of superior products.
Ready to revolutionize your quality control process? Contact us today to discover how Dashboard can be tailored to your unique manufacturing environment.