
From China’s EV dominance to Japan’s innovation push, the electric vehicle landscape in Asia is evolving fast.
The Electric Vehicle market is divided into distinct two distinct markets, namely Battery Electric Vehicles (BEVs) and Plug-in Hybrid Electric Vehicles (PHEVs). This categorization allows for a nuanced understanding of the market dynamics, considering the specific attributes and market penetration of each electric vehicle type. The emphasis on new car sales and their foundational configurations ensures clarity, while the exclusion of used vehicles and customizations maintains focus on the evolving landscape of electric vehicles.
- In 2025, the projected revenue in the Electric Vehicles market in Asia is estimated to reach a staggering US$407.6bn.
- This market segment is expected to demonstrate a consistent annual growth rate (CAGR 2025-2029) of 2.68%, resulting in a projected market volume of US$453.1bn by 2029.
- It is anticipated that the unit sales of Electric Vehicles market in Asia will reach 10.18m vehicles by 2029.
- Furthermore, the volume weighted average price of Electric Vehicles market in Asia in 2025 is expected to amount to US$47.3k.
- When considering the international perspective, it becomes evident that China will generate the highest revenue, with an estimated US$377bn in 2025.
- In Japan, the government’s push for innovation and investment in electric vehicles has resulted in a surge of EV adoption and a growing charging infrastructure.
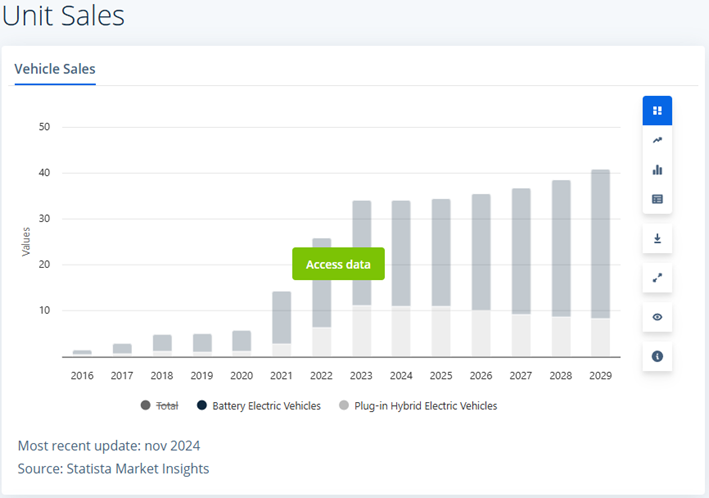
From 2016 to 2021, there was a gradual yet moderate increase in electric vehicle sales. Starting in 2022, sales experienced a significant surge, with remarkable growth in Battery Electric Vehicles (BEVs), which surpassed Plug-in Hybrid Electric Vehicles (PHEVs). From 2023 onward, total annual sales stabilized into a steady growth trend, projecting figures above 40 million units by 2029.
The chart highlights how 100% electric vehicles have become the dominant category, with a growing gap compared to plug-in hybrids throughout the projected period. This indicates a market preference for fully electric technologies, aligned with global sustainability and transportation electrification policies. Overall, the image provides a clear view of the ongoing rise of the electric mobility sector in the coming years.
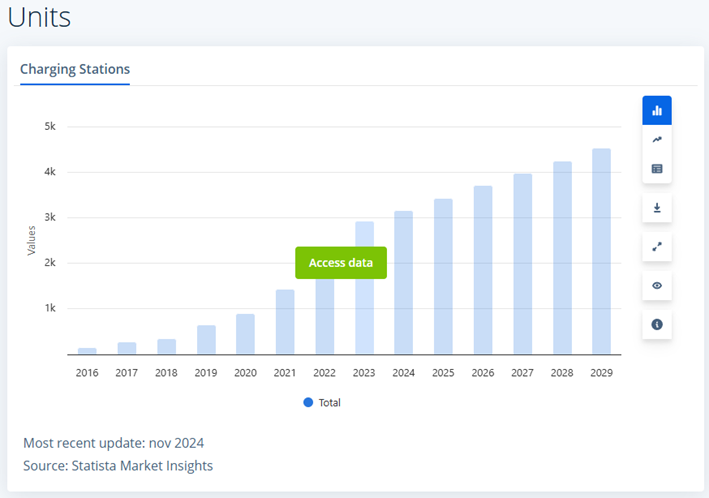
Between 2016 and 2020, the growth in the number of charging stations was progressive yet still moderate, remaining below 1,000 units. Starting in 2021, a more notable acceleration is observed, with a steady rise surpassing 3,000 units by 2024. Projections indicate that the total number of stations will exceed 5,000 units by 2029, reflecting a clear infrastructural response to the growing demand for electric vehicles.
This consistent growth highlights the commitment to expanding charging infrastructure, a key factor in facilitating the mass adoption of electric mobility. Alongside electric vehicle sales data, the chart suggests a parallel and complementary evolution between the expansion of the electric vehicle fleet and the availability of charging points.
The Electric Vehicles market in Asia is experiencing significant growth and development due to several key factors.
Customer Preferences
- Asian consumers are increasingly drawn to electric vehicles due to their zero-emission nature and lower long-term costs.
- Air pollution in dense urban areas boosts demand for cleaner mobility.
- Rising fuel prices and generous government subsidies enhance EV appeal.
- These factors make EVs a practical and eco-conscious choice for many.
Trends in the market
- EVs are gaining longer range thanks to advances in battery technology.
- The number of available charging stations across Asia continues to rise.
- Automakers are expanding their EV portfolios to meet diverse consumer needs.
- This competition drives innovation in design, performance, and pricing.
Local special circumstances
- Asia’s EV growth varies by country, depending on infrastructure and policy support.
- China leads with strong subsidies, tax incentives, and strict emissions rules.
- Less developed regions are progressing slower but are starting to catch up.
- Improved infrastructure and tech access will help balance regional disparities.
Underlying macroeconomic factors
- Urbanization and a rising middle class are fueling EV demand across Asia.
- EVs offer a cost-efficient, sustainable solution for modern transportation needs.
- Asia hosts major EV producers investing in R&D and production facilities.
- These macro trends reinforce Asia’s leadership in the global EV market
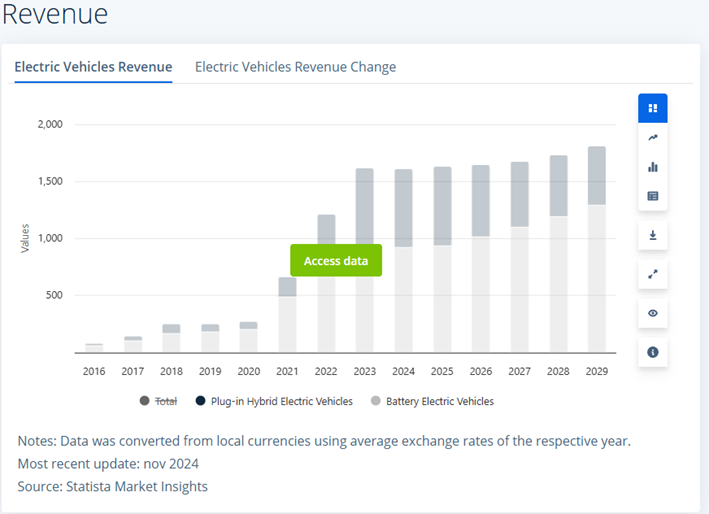
From 2016 to 2020, revenues were relatively low but showed steady growth. Starting in 2021, revenues increased significantly, reaching their estimated peak around 2023, surpassing 1.5 billion monetary units. Subsequently, total revenues stabilized, remaining high and exhibiting slower but sustained growth through 2029, when values are projected to approach 2 billion.
It is important to note that the majority of revenue comes from 100% electric vehicles (BEVs), while Plug-in Hybrid Electric Vehicles (PHEVs) contribute less and more consistently. This reinforces the market trend toward full electrification, with a gradual shift in consumer behavior toward fully electric mobility solutions. In summary, the chart reflects a mature industry, with strong growth in the first half of the decade and consolidation in the final projected years.
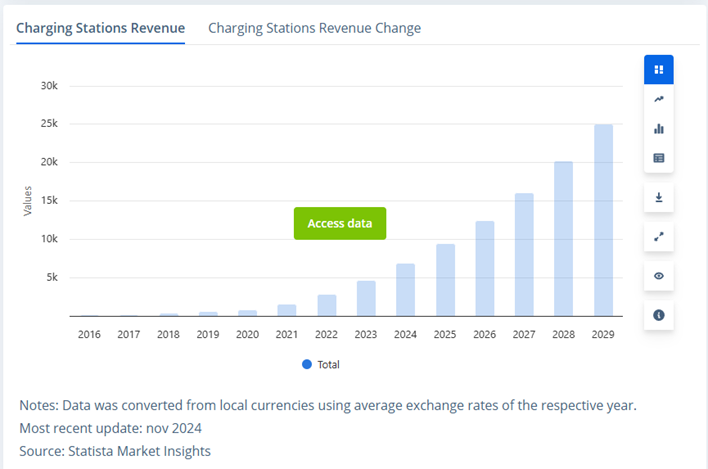
Throughout the chart, a sustained growth trend is observed, with a particularly sharp acceleration starting in 2021. Between 2016 and 2020, revenues were marginal, reflecting an early phase of infrastructure deployment. However, beginning in 2022, exponential growth takes off, reaching approximately 10,000 monetary units by 2025 and surpassing 20,000 by 2028. By 2029, charging station revenue is projected to exceed 25,000, nearly tripling the figures from 2024.
This trend reinforces the idea that charging stations are not only increasing in number, as shown in a previous chart, but are also generating increasingly significant revenue. This may be attributed to the growing adoption of electric vehicles, greater use of public charging points, and the ongoing professionalization of the sector.
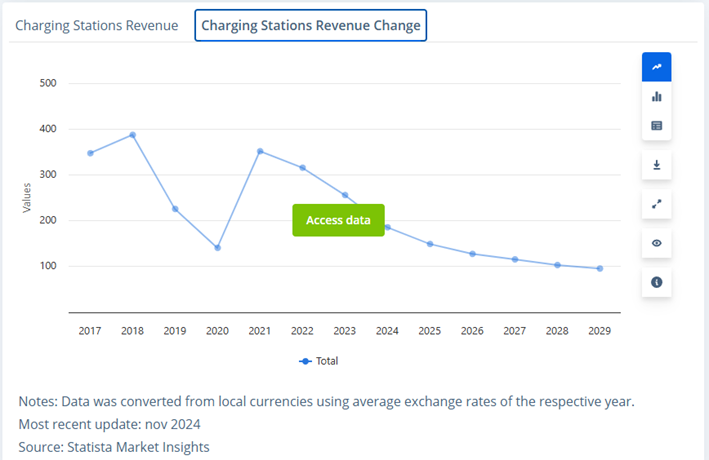
The chart reveals a volatile pattern during the early years of the analyzed period. Between 2017 and 2018, revenues increased, but in 2019 and 2020, they suffered a sharp decline. In 2021, there was a significant rebound, although growth began to moderate in 2022 and entered a clear downward trend starting in 2023. This decline continues steadily until 2029, the year in which the revenue variation is the lowest of the entire series, falling below 100 value points.
This decline does not necessarily imply a reduction in absolute revenue (as shown in the previous chart), but rather a decrease in the year-over-year growth rate. In other words, while charging station revenues continue to rise in absolute terms, the growth rate is slowing down, something that can be interpreted as a sign of market maturity.
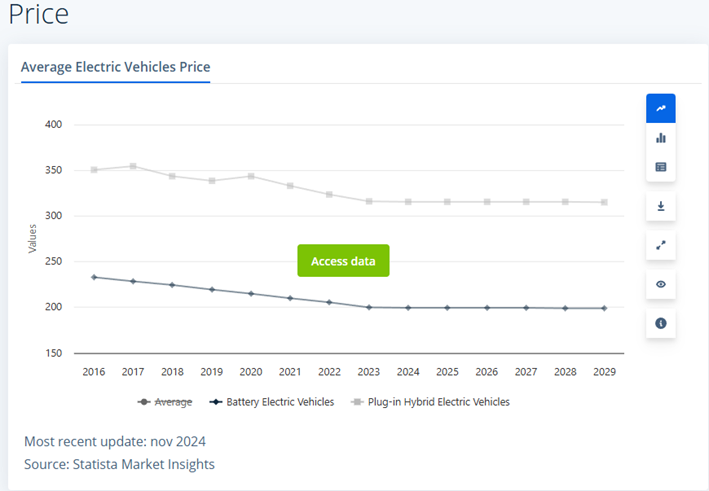
Since 2016, prices have shown a clearly downward trend. In particular, the average price of Battery Electric Vehicles (BEVs) has steadily declined, dropping from values near 230 units in 2016 to just over 200 units projected for 2029. This decrease reflects progress in economies of scale, technological improvements in batteries, and increased market competition.
On the other hand, Plug-in Hybrid Electric Vehicles (PHEVs) have maintained a higher price over time, with a slight decrease, stabilizing around 310–320 units in the later projected years.
Overall, the chart highlights a sustained reduction in the average price of electric vehicles, mainly driven by the drop in BEV prices, which could encourage greater consumer adoption.
Additionally, the stabilization of prices starting in 2024 suggests potential maturity in the sector’s value chain, with more controlled margins and increasingly affordable technologies.
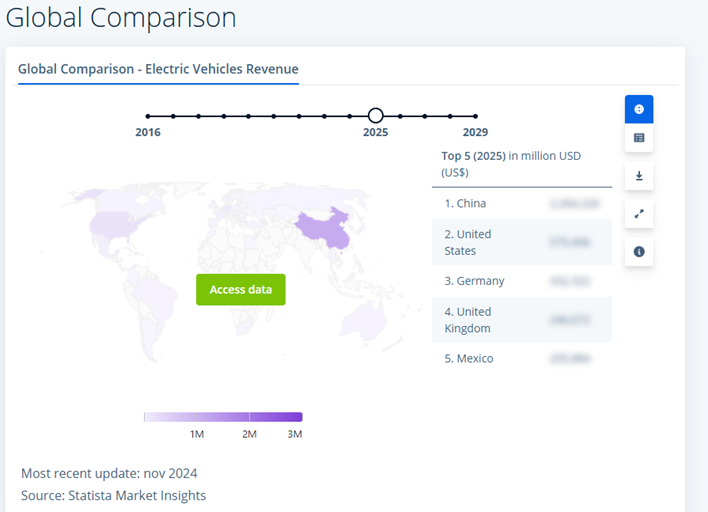
The darker the shade, the higher the revenue volume in millions of U.S. dollars (USD). At the bottom, a color scale indicates that values range from 1 million to over 3 million USD.
On the right, the five leading countries in electric vehicle revenue for 2025 are highlighted:
- China – by far the absolute market leader, represented by the darkest tone on the map.
- United States – second place, with significantly lower revenue figures than China.
- Germany
- United Kingdom
- Mexico
These countries represent the main hubs of electric vehicle demand, likely influenced by factors such as public policy, tax incentives, technological advancements, and the size of their automotive markets.
China’s leadership reflects its dominant role in both the production and consumption of electric vehicles, while Mexico’s presence in the top 5 underscores the rise of emerging markets in this industry. This global comparison highlights the geographic concentration of revenue around key economies driving the electrification of transportation.
Source: https://chinawatch.elpais.com/economia/los-aranceles-de-estados-unidos-podrian-alterar-las-cadenas-de-suministro-en-todo-el-mundo/